Engagement MVP
Time: 3 weeks
Scope: UX/UI, Project Scoping
Problem
Our b2b product, Teamwork Pro has two functions:
It helps managers better understand the blend of personalities on their team by getting each team member to take a personality assessment.
Provides personality data to recruiters and hiring managers and allows them to see how candidates would fit into a team.
We discovered that the app was mostly being used by managers when hiring. Because this can be sporadic, we were not able to easily re-engage these users.
The product team worked with sales and customer support to better understand manager’s problems and decided to move forward with an idea for an employee engagement feature at the team-level (most competitor engagement products are at the company-level).
Our hypothesis was that by sending short (6 question) weekly surveys to specific teams and adding our psychometric secret sauce to provide actionable recommendations, managers would have a way to measure and understand problems on their team.
User Story
“As a team manager, I need a way to understand my team’s current level of engagement and to track engagement over time.”
Constraints
Our parent company put the pressure on us to deliver this feature under a tight deadline. We had to de-scope on many of our original ideas in order to deliver on time.
Our team of personality scientists had many different ways of presenting the data collected from surveys. The main design challenge was to present data visualizations that were easily understandable to managers who were not necessarily data nerds.
Process

Research
I spent time with 4 managers (would-be users of this feature) with the purpose of discovering:
The natural hierarchy of data that we are able to provide, which data points are most useful and which ones they could do without
Their mental model of engagement products
The effectiveness of different types of data visualization
Session Outline
Scenario
Ask participants to imagine that the have a team of 10-20 people and that they are experiencing difficulty with their team. They start using the Teamwork Pro engagement surveys to monitor the health of their team over time.
Card Sorting Exercise
Show them cards with written descriptions of the data that is available to them after surveys are taken. Ask them to read the cards and sort them from most important to least important. Ask them to talk out loud while doing this.
Wireframe Presentation
Show the latest wireframe and ask them to talk out loud while reading different charts to gage ease of understanding and current mental model of engagement survey products.


Key Insights
Managers cared most about:
Their overall engagement score
The current results compared to the baseline results (What was the net change? Did we improve?)
The results broken down by factor (highlights specific questions that scored poorly)
Seeing recommendations to fix problems on their team
Most effective data visualizations:
100% stacked bar charts for quick reading
The prominence of the overall engagement score was very important (the larger the better, displaying it on its own card was most effective)
Solutions
Survey
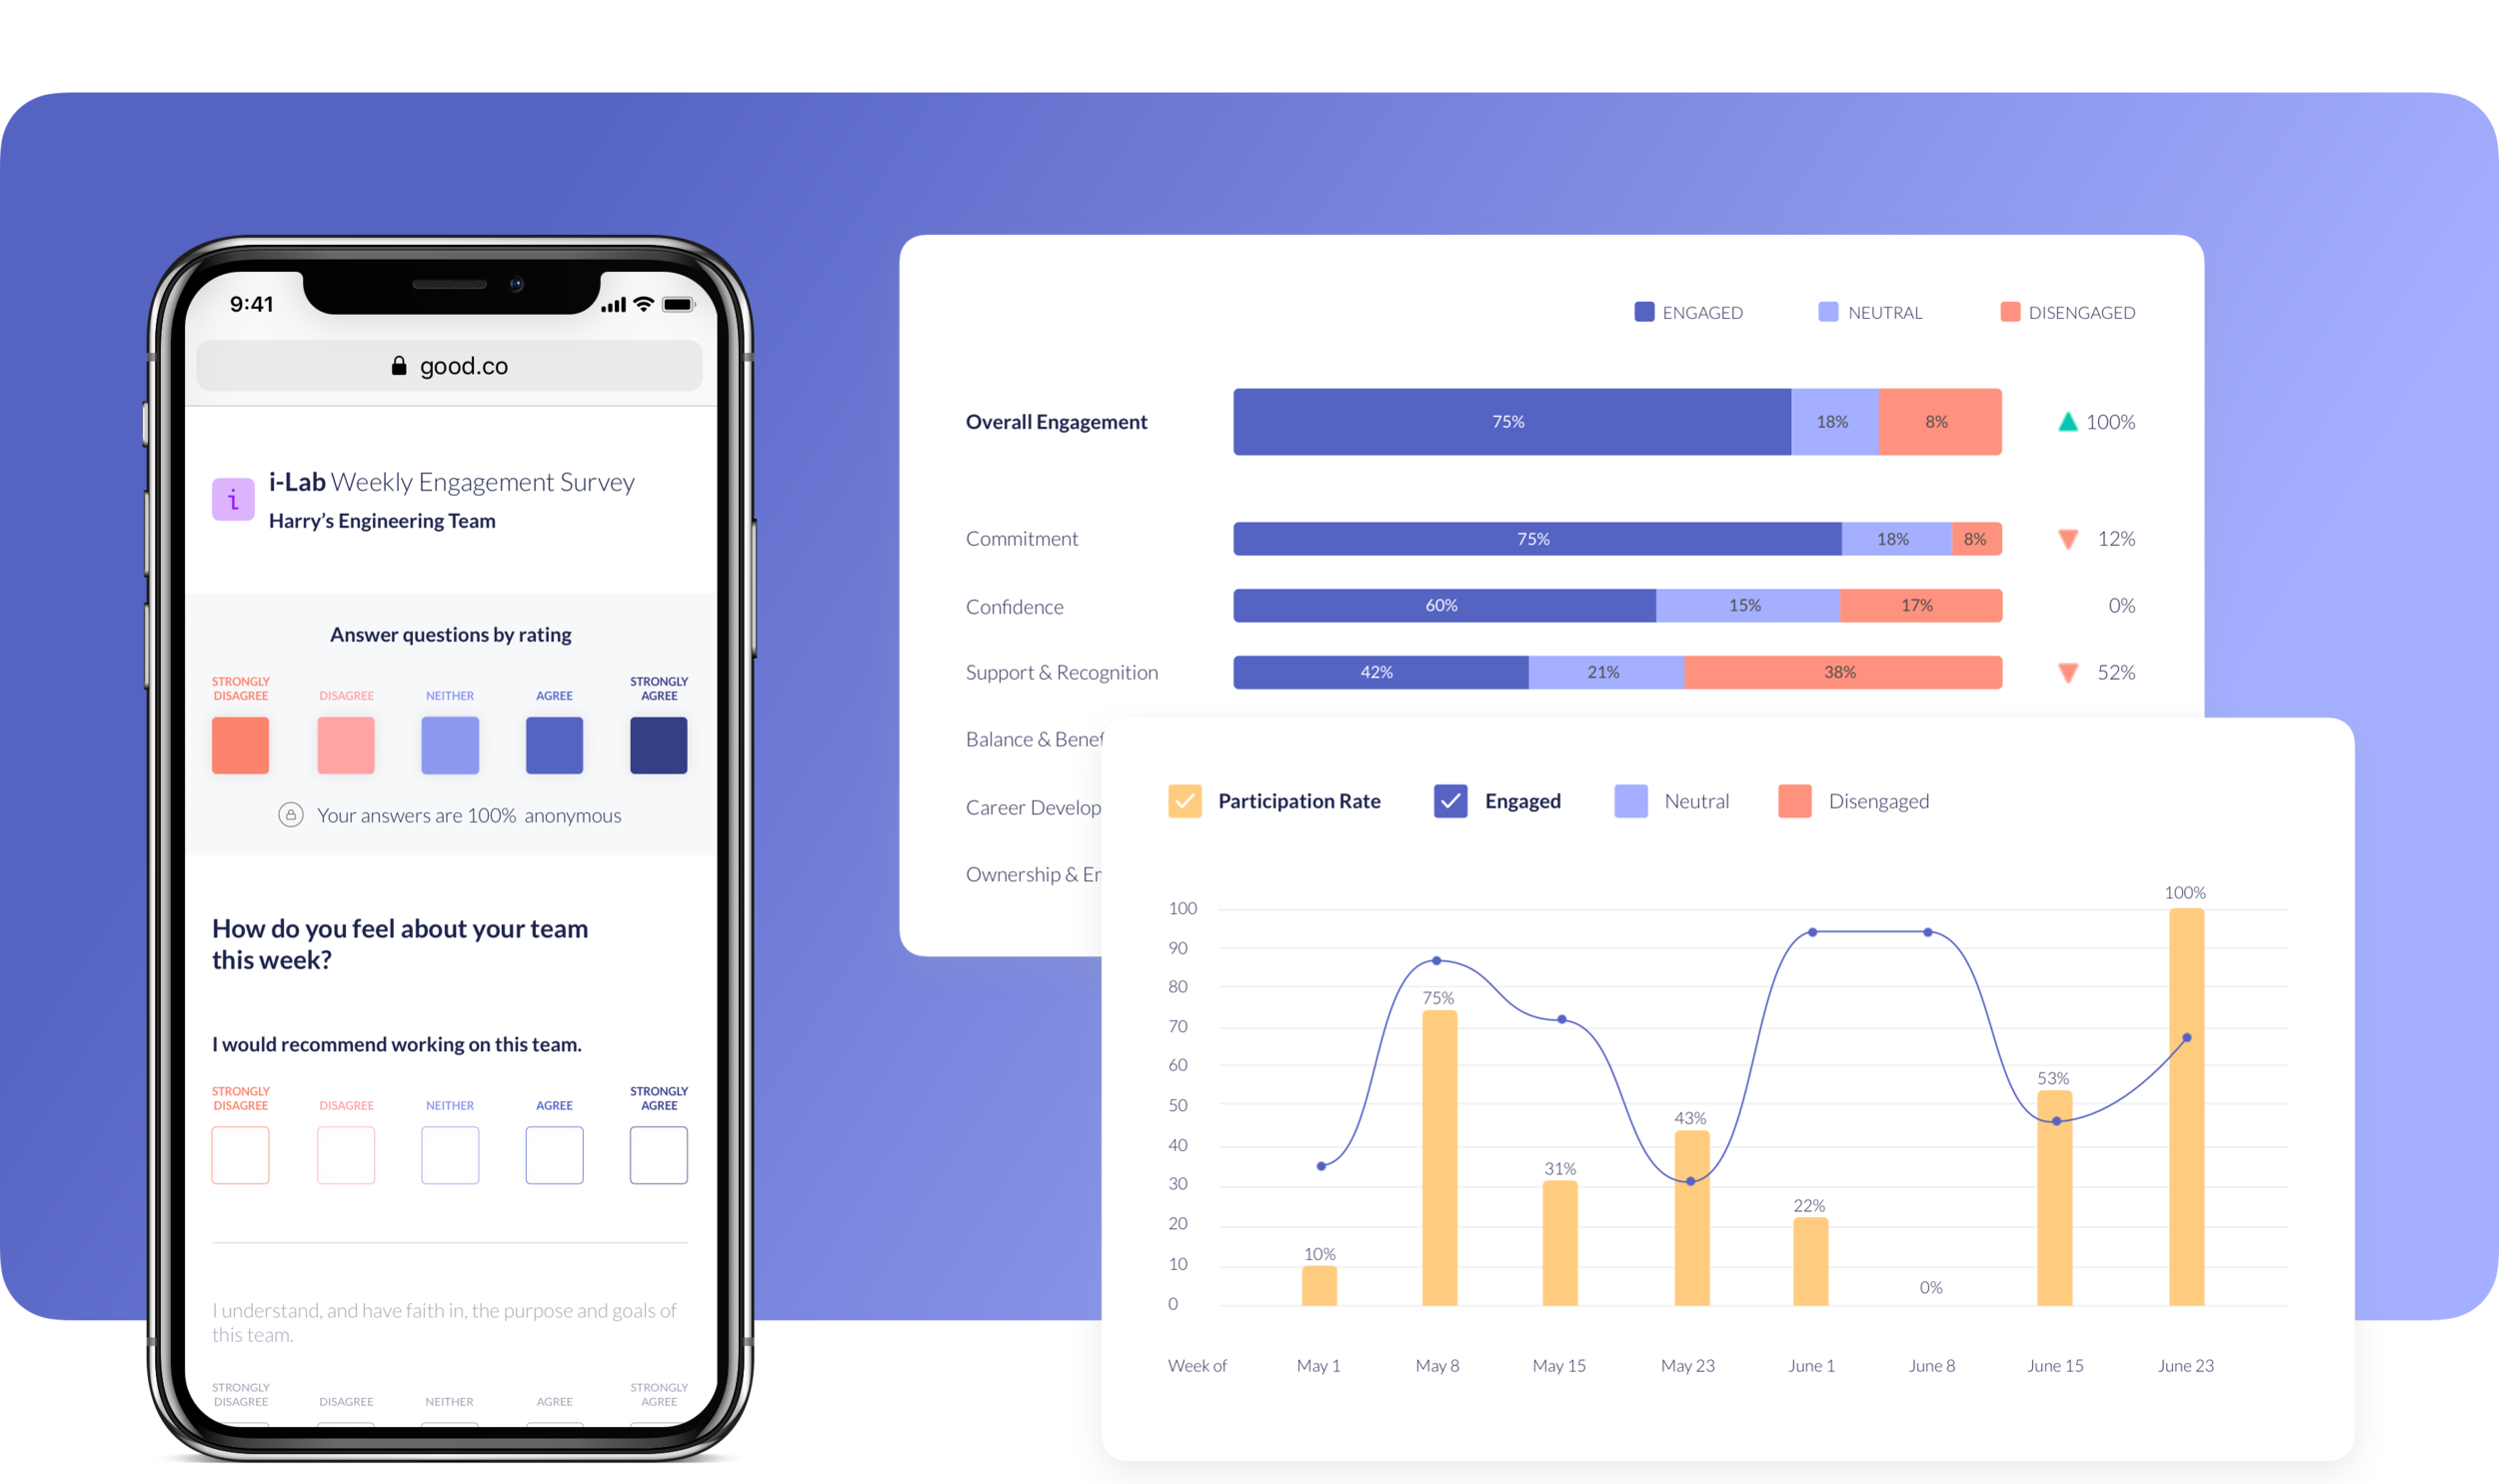
The 6 question survey is emailed to team members on a weekly basis. Large square buttons make it quick and easy to submit results.

Engagement Dashboard
The overall engagement score takes prominence, based on conversations with managers who need a quick read of their team’s engagement.
The psychometric analysis and recommendations are also prominent as this information adds an extra layer of value which sets us apart from competitors.
The high-level overview of results in stacked 100% bar charts is easy to read.

Results broken down by area
Managers can use the side navigation to see results broken down by each area that we survey. This allows them to see detailed results of each question and recommendations specific to each area.

Next Steps
After successfully delivering our MVP on schedule, we have time to go back and make refinements. I have interviewed some early users and discovered that the first time experience needs clarification and that scheduling controls (an idea that was de-scoped due to our deadline) are highly valued.
More Projects


